Benchmarks
The results on this page come from scripts in the repository and their archived runs, from the paper (TMLR 2026, which describes release 0.4.2), or from the changelog. Results with a random component carry Monte Carlo error from a finite number of trials, so read them at the precision given. Some of the paper's results have moved since: two bugs fixed in 0.5.0 change a few, and some figures come from runs made under an earlier release. They are marked where they apply and described under Reading the paper today. Installation describes the environment the comparisons need.
Unless a result says otherwise, it was measured with constants inside
expressions off (fitted_ops=()), the default before 0.6.0. The scripts build
their estimators at the current defaults, so to reproduce an archived result,
run the script through the options launcher with the old default:
BEAMFEAT_OPTIONS='{"fitted_ops": []}' \
    python benchmarks/search_stress/with_options.py benchmarks/run_benchmarks.py
This reproduces the archived core-suite R² of every synthetic problem to within 1e-10. At the current defaults (since 0.6.0), the core suite recovers the same 10/10 formulas, Friedman #1 rises from 0.745 to 0.765 and the other problems move by at most 0.0004; the robustness suite recovers the same 5/5, with R² lower by at most 0.004 (the distractors at 50% noise, 0.776 to 0.772); and the end-to-end calibration below is unchanged.
High-dimensional data
benchmarks/additional_experiments/
compares beamfeat with ridge, random forest and LightGBM on the raw columns of
nine datasets with 81 to 4,088 columns, over five random 75/25 splits each
(the paper's Table 6). Mean held-out R², the best in each row in bold:
| dataset | columns | ridge | random forest | LightGBM | beamfeat | formulas |
|---|---|---|---|---|---|---|
| tecator | 100 | 0.957 | 0.717 | 0.756 | 0.991 | 3.6 |
| geomusic | 117 | 0.805 | 0.739 | 0.739 | 0.805 | 9.6 |
| communities | 100 | 0.650 | 0.638 | 0.632 | 0.641 | 11.6 |
| riboflavin | 4,088 | 0.579 | 0.436 | 0.493 | 0.544 † | 17.4 |
| eyedata | 200 | 0.479 | 0.340 | 0.031 | 0.416 | 34.0 |
| superconduct | 81 | 0.725 | 0.884 | 0.884 | 0.731 | 16.2 |
| blogfeedback | 280 | 0.379 | 0.548 | 0.535 | 0.415 | 18.4 |
| ct_slices | 384 | 0.852 | 0.981 | 0.981 | 0.687 † | 14.0 |
| ujiindoorloc | 520 | 0.949 | 0.995 | 0.993 | 0.812 † | 20.0 |
"formulas" is the mean number of terms in beamfeat's fitted equation.
† Corrected since the paper: rerun with 0.5.0, beamfeat's mean R² is 0.340 on riboflavin, 0.664 on ct_slices and 0.816 on ujiindoorloc.
beamfeat leads where the target is a compact algebraic function of a few
columns, as on tecator, where ratios of absorbance channels are features that
threshold splits cannot build. It trails where the signal is spread thinly
over hundreds of columns, as on ct_slices, ujiindoorloc and blogfeedback:
ridge keeps every column and shrinks it, while a screen with an error-rate
guarantee has little power to reject the null for features that each carry
a small fraction of the signal, and leaves them out.
With the corrections, it is ahead of both tree ensembles on four of the nine
datasets: tecator, geomusic, communities and eyedata. fdr_controlled_ was
true on all 90 beamfeat fits of the archived run (the estimator and the
transformer).
On tecator, a random forest given the formulas in place of the raw channels goes from 0.739 to 0.992, on three of the five splits. On the small datasets, tree models given the formulas do worse than ridge, which is why ridge is the default.
Tecator also shows what a single fit does not. In the paper's stability study,
thirty fits with different seeds on one partition (the design of
stability_report(..., resample="seeds")) held R² at 0.989, with a standard
deviation of 0.004, while selecting 79 distinct features, counting
value-equivalent ones once, none of them in more than 8 of the 30 fits.
Adjacent channels correlate at 0.99988, so many band pairs are
near-substitutes and each fit picks among them. The
user guide shows how to run the same
check on other data.
Selection calibration
- Selector level
(
benchmarks/selector_calibration.py). On Gaussian designs over 100 trials, Benjamini–Hochberg realised 0.046 ± 0.008, 0.084 ± 0.012 and 0.161 ± 0.016 at nominal 0.05/0.10/0.20, against its ceiling ofq·m₀/m= 0.040/0.080/0.160; Benjamini–Yekutieli, stricter by a harmonic factor, realised 0.013 ± 0.005, 0.018 ± 0.005 and 0.046 ± 0.008. Power was 1.00 throughout. The bounds are computed from the design, and the script stops with an error if a bound falls below a realised rate's whole 95% interval. - End to end
(
benchmarks/calibration_study.py). Search plus holdout selection at nominal FDR 0.10, on 500 rows and 6 input columns of which 2 carry signal through their product, with noise at 5% of the signal's standard deviation: no false discovery in 200 replicates, a 95% upper bound of 0.015 on the true rate, power 1.000 and no fallbacks. Over 60 global-null replicates, nothing was selected. - Pure noise
(
benchmarks/selector_calibration.py). Over 100 global-null pipelines, where every rejection is a false rejection by construction, BH returned features in 6 trials and BY in 1, false discovery proportions of 0.06 and 0.01, both under the nominal 0.10. At this trial count the exact paired test does not reject equal rates (p = 0.06): both corrections saw the same 100 datasets, and the one trial on which BY selected is among BH's six. BY is the estimator default because it is valid under arbitrary dependence, and this result is consistent with that choice.
The guarantees page states what each procedure guarantees and under which assumptions.
Formula recovery
- Known formulas
(
benchmarks/run_benchmarks.py, 70/30 splits). Mean R² over the ten core-suite problems, and recovery of the generating columns over the ten synthetic problems that declare them; the two sets differ by one dataset each. beamfeat: mean R² 0.9989, fits of about 0.2 s, 10/10 recovered. autofeat: 0.9970, about 12 s, 8/10. LightGBM 0.9798, ridge 0.8442. On the purely linear problem, where feature construction has nothing to add, ridge ties beamfeat. - Feynman equations
(
benchmarks/feynman_panel.py, 12 physics laws, 0.1% noise). 10/12 solved at the SRBench criterion, and the exact symbolic form on 8 of the 9 laws that have one, at 0.9 s per equation in the archived run, which predates the 0.5.0 search speed-up. The misses there are known limits of the search space: a depth-3 rational, a literal constant, depth-4 nesting and the Gaussian's exponential. Withfitted_ops, on by default since 0.6.0, the last two are within reach: the Gaussian comes out asexp(-0.5*(x0)^2)and relativistic velocity addition as(x0 + x1)/((x0*x1) + 1), the exact form on 10 of the 11 laws that have one within the depth, still 10/12 solved, at 0.4 s per equation. - Heavy-tailed noise (Student t(2), infinite variance). The exact formula is recovered, at R² 0.956 against LightGBM's 0.866. The permutation test is distribution-free, so heavy tails do not affect its validity.
Distractors and false features
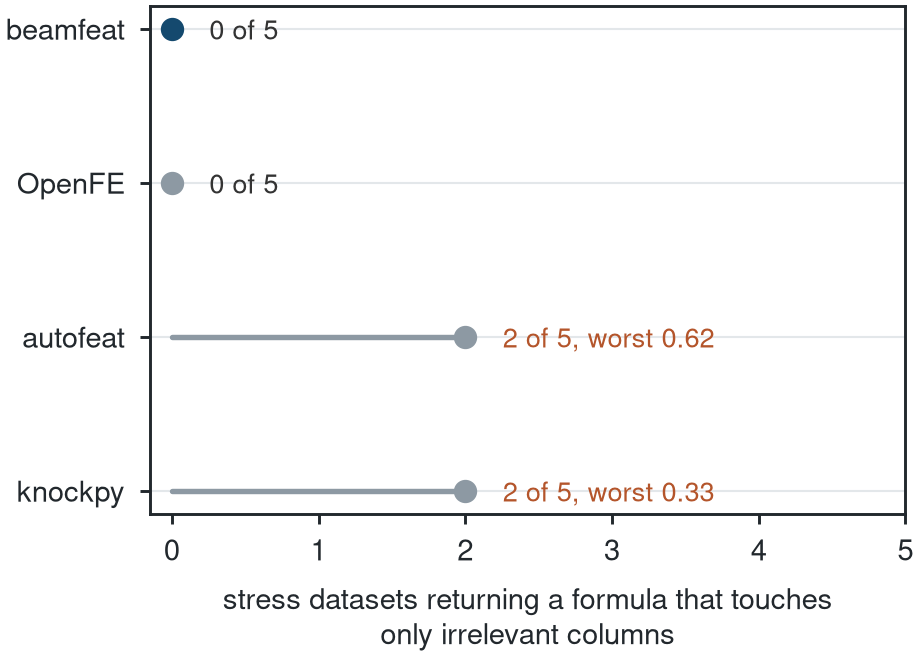
Signal hidden among ten distractor columns. A false feature is a returned
formula touching only irrelevant ones; the count is over the five stress
datasets that declare which columns their formula uses. Regenerate with
python
benchmarks/make_figures.py,
which writes six other figures alongside it.
- Stress suite (signal among ten distractor columns). beamfeat's false-feature rate, the share of returned formulas that touch only irrelevant columns, is 0.000 at noise levels from 5% to 50% of the signal scale and at n as small as 120, with recovery and the guarantee intact throughout. autofeat recovers the formula as often but returns distractor-only features on 2 of the 5 scoreable datasets. The comparison is a count rather than a mean, since a mean over five datasets carries a standard error of about 0.15, and autofeat's output varies between processes.
- OpenFE on the same suite (its features feeding LightGBM, after shimming a removed scikit-learn parameter): a false-feature rate of 0.000 as well, but 0/5 formulas recovered and a lower R² on all five. It optimises a tree model's lift rather than equations.
- Selection alone (knockpy on the raw columns, with the modified-FDR offset, the only satisfiable configuration at these dimensionalities): 0/15 formulas recovered, a core-suite R² at the ridge level (0.845), and distractor-only features on 2 of the 5 scoreable stress datasets. The difference from beamfeat is the construction step and the holdout.
Real datasets
Seven datasets, numeric columns only. beamfeat leads on mpg (0.864 against LightGBM's 0.853) and on tips, where gradient boosting overfits below ridge while the FDR screen keeps beamfeat at the top. It ties ridge on diamonds with one interpretable feature. It trails LightGBM on penguins, breast cancer and California housing (0.700 against 0.843, where the signal is spatial), and ridge on diabetes (0.376), where there is no nonlinear structure to find and beamfeat adds none.
Known limits
- Piecewise targets suit trees: on a threshold problem, LightGBM reaches 0.998 and beamfeat 0.808. When a tree model beats beamfeat by a wide margin, the signal is likely piecewise rather than algebraic. OpenFE also records 0.998 there, but bit-identically to raw LightGBM and from a feature touching only an irrelevant column, so the result belongs to its tree model.
- Laws whose parts do not correlate with the target
(
benchmarks/search_stress/). With centred inputs, the parts ofx0*x1*x2, and ofx0*x1among hundreds of columns, do not correlate with the target, so the default search can drop them before it combines them. Over 50 fits per cell, on inputs uniform on (-1, 1),x0*x1*x2is recovered exactly in every fit with 5 columns but in 0.54, 0.18 and 0.10 of them with 20, 100 and 300, andx0*x1in 0.32 with 1,000 columns; on shifted inputs the same laws are recovered in every fit. A wider beam does not close the gap. The opt-inmagnitude_slots=10recovered every lost cell but one crowded sum law (0.88), at 1.2 to 1.7 times the fit time, and left the real-data suites and the false-discovery rates essentially unchanged; the guide shows how to use it. - Friedman #1
(
benchmarks/friedman_decomposition.py). Over six draws, a representation oracle reaches 0.960 ± 0.003, a screening-admissible ceiling 0.874 ± 0.006, and the pipeline 0.780 ± 0.013. About 0.086 is lost to what marginal screening cannot see: the centred quadratic term is nearly uncorrelated with the target on its own, so a marginal screen has almost no power to reject its null. The other 0.094 is lost in the search. The guarantees page explains the marginal null.
Independent comparison
benchmarks/independent/
holds a 360-fit study (nine datasets, eight methods, five splits, average ranks
and a Friedman test) with its harness, pinned environment, data, and a
notebook that reproduces the analysis. Mean held-out R²: random forest 0.810,
beamfeat 0.803, LightGBM 0.798, OpenFE 0.736, ridge 0.704, autofeat −1.561
and featuretools −2.478. The worst of each method's 45 fits: beamfeat 0.355,
autofeat −103.2 and featuretools −57.3; no beamfeat fit fell below zero.
beamfeat ran at about 60 times autofeat's speed, and fdr_controlled_ was
true on 45 of 45 fits. The featuretools figures come from a harness that
filled its non-finite test cells with 0; with the training medians, as the
harness now fills them, they read 0.461 and −12.882 (see
Reading the paper today).
PROVENANCE.md
records what reproduces and what does not. beamfeat's selections reproduce
bit-identically, though the fitted model's cross-validated penalty can flip
on marginal problems. autofeat sets no random_state and draws its decoy
features from the global NumPy generator: six runs on one identical split
ranged from +0.952 to −109.8.
Relationship to autofeat
beamfeat's design began from a code review of autofeat (Horn et al., 2019). It keeps autofeat's central idea, compact symbolic features feeding a linear model, and replaces exhaustive expansion with beam search, noise-threshold selection with FDR-controlled procedures, and upper-pinned dependencies with tested floors. The generate-then-filter design has a direct precedent in tsfresh (Christ et al., 2018), which filters mass-generated time-series features under Benjamini–Yekutieli control; beamfeat applies it to symbolic expressions on tabular columns. Migrating from autofeat maps one API onto the other.
Release comparison
benchmarks/release_comparison/
runs the same benchmarks, data, splits and seeds through 0.4.2 (the paper's
release), 0.5.0, 0.6.0 and 0.6.1 on one software stack, at their defaults
and with the options 0.6.0 and 0.6.1 add: about 16,000 fits. At the
defaults:
| measure | 0.4.2 | 0.5.0 | 0.6.0 | 0.6.1 |
|---|---|---|---|---|
| Feynman panel, solved of 60 | 47 | 47 | 50 | 50 |
| Riders at signal to noise 1 (conditional FDR) | 0.736 | 0.736 | 0.720 | 0.720 |
| 7 real datasets, mean held-out score | 0.725 | 0.726 | 0.726 | 0.726 |
| Fit time (× 0.5.0) | 3.18 | 1.00 | 1.53 | 1.54 |
| Peak fit memory (× 0.5.0) | 5.27 | 1.00 | 1.08 | 1.10 |
0.5.0 gives 0.4.2's fits on 1,415 of 1,430 items in a third of the time.
0.6.0's changes to the fits all come from fitted_ops, and 0.6.1's default
fits are 0.6.0's. The
report
also measures each option against its release's default.
Test suite
988 tests at 97% statement coverage, with a 90% floor enforced in CI, including scikit-learn's full estimator-conformance checks.
Reading the paper today
The paper describes release 0.4.2, archived with its run records at 10.5281/zenodo.23417132. Some of its numbers differ from what current releases give, for three reasons: two bugs, figures from runs made under an earlier release, and speed. The archived records are kept as they were run.
Two bugs, fixed in 0.5.0
- Comparison harness. The harness filled non-finite test cells of the
constructed features with 0, while the training cells got the training
median. This understated featuretools, whose ratio features divide by
columns that contain zeros. With the training medians on both, featuretools
has a mean R² of about 0.461 rather than −2.478 in the independent
comparison, a worst fit of −12.882 rather than −57.320, and one fit below
zero rather than six. Every other method's row, and every conclusion about
beamfeat, is unaffected
(
PROVENANCE.md). - Search. When
max_candidates_per_depthbound at depth 1, the first round proposed parents in column order, so from about 258 inputs, pairs among the last columns were never proposed. The first round now proposes the inputs in order of their score, as documented. Three datasets of the high-dimensional study reach the ceiling. Rerun with 0.5.0, beamfeat's mean R² is 0.340 on riboflavin, 0.664 on ct_slices and 0.816 on ujiindoorloc, against 0.544, 0.687 and 0.812 in the paper; the archived riboflavin run was made with an earlier version, and 0.4.4 gives 0.523 there. With the ceiling raised so that every input is proposed, ct_slices and ujiindoorloc give the new results exactly; the old ones depended on which columns came first in the file. beamfeat now leads both tree ensembles on four of the nine datasets rather than five.
Figures from runs made under an earlier release
These are not bugs. The method is the one the paper describes, but the release that produced the figure is not the one it names, and the figures move little:
- riboflavin, in the high-dimensional study, as noted under the search bug above.
- The independent comparison. Its archived run predates 0.3.0, when the
internal ridge penalty was fixed at
alpha=1. Rerun with 0.4.2,beamfeat_ridgematches 37 of the 45 archived fits to four decimals, with a mean of 0.8034 against 0.8033 (PROVENANCE.md). - threshold_step, in
run_benchmarks.py's robustness results, which were regenerated under 0.3.0. The paper quotes beamfeat's held-out R² there as 0.808, and 0.4.2 with the script's own settings gives 0.843. It reproduces the script's other 19 datasets and the Feynman panel exactly, and the five other robustness datasets to within 0.003 with the same number of terms (release comparison). That check cannot tell whether the release or the software environment causes the difference.
Speed and memory
Later releases are faster, so the paper's timings and memory figures describe 0.4.2. 0.5.0 runs the high-dimensional study 2 to 28 times faster per dataset without changing any feature, p-value or prediction, and a default fit on 1000 columns and 600 rows that peaked at 2.6 GB of memory now peaks at 0.35 GB. Over the eight timing items of the release comparison, 0.5.0 fits 3.2 times faster than 0.4.2 with a fifth of its memory, and 0.6.0 and 0.6.1 take 1.5 times 0.5.0's time. The changelog lists every change.